The Geometry of Optimal Controlby John Hauser and Hinke Osinga |
|
Next: Quasiperiodically forced
systems
Up: Hinke's Home Page
Prev: Algorithms for Dynamical Systems
The Geometry of Optimal Controlby John Hauser and Hinke Osinga |
|
We study the geometry of the optimal solution to the problem of balancing an inverted planar pendulum on a cart subject to a quadratic cost function. The cart moves in the plane of the pendulum with an applied horizontal force u constituting the control. The mass of the cart is M, the mass of the pendulum m, and its center of mass is at distance l from the pivot. The model equations for the pendulum are given by
Here, x1 is the angle measured from the vertical up position, mr = m / (m + M) is the mass ratio, and g is the gravitational constant. We do not consider the model equations associated with the cart. The origin is an unstable equilibrium corresponding to the vertical position above the pivot.
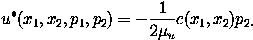
The cost function is quadratic and depends on the state variables x1, x2, and the input u:

There exists (sometimes more than) one optimal control
u* as a function of x1 and
x2 that drives the system to the origin, while
minimizing this cost function. As parameters we choose m = 2
kg, M = 8 kg, l = 0.5 m, g = 9.8 m /
s2,  1 = 0.1, 2 = 0.05, and u = 0.01.
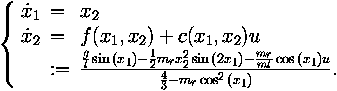
The pictures and animations below study the solution surface given by
the graph of the cost function versus (x1,
x2) using the optimal control
u*. This surface is colored according to cost,
going from blue, low cost, to red, high cost.
| Still images | A series of pictures showing the surface of (locally) optimal solutions at several levelsets of the cost function. |
|
| |
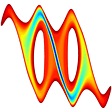 |
The animation colors the plane with respect to optimal costs; blue is low cost, red is high cost. The cost increases up to 10.89. Note that the x-axis represents an angle, -Pi and Pi are the centers of the two holes (512KB). |
|
| |
 |
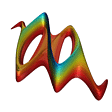
The animation shows how the surface of (locally) optimal solutions grows with increasing values of the cost function (340KB). |
|
| |
 |
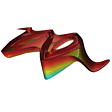
The same surface, but now upside down. The animation starts with a view down the z-axis (the value of the cost function) with the positive x- and y-axes pointing to the right and up, respectively (491KB). |
It is known that the optimal solutions lie on the stable manifold of the origin of a Hamiltonian system given by the Hamiltonian:

with
The Hamiltonian system is four-dimensional, with the first two
coordinates representing state space and the second, dual pair of
coordinates related to the optimal control as defined above. This
control is optimal, that is, it achieves the minimum of the cost
function, for points (x1, x2,
p1, p2) that lie on the stable
manifold of the origin. Hence, more than one optimal control
u* exists when the plane (x1,
x2) = const intersects the stable
manifold of the origin more than once.
 |
Optimal solutions lie on the two-dimensional stable manifold of the corresponding Hamiltonian system. The animation shows how this stable manifold grows in four projections at the same time (2.4MB). |
|
| |
 |
We color the manifold of locally optimal solutions in (x1, x2, p1, p2)-space according to cost. The animation shows how the cost grows by displaying the part of the manifold associated with growing constant cost in four projections at the same time (715KB). |